¶ Week 1 lab · Functions, Graphs and Charge
Study guide · Curriculum · فارسی
¶ Purpose and preparation
Turn a formula into a graph and distinguish a graph’s height from its slope. This lab uses only Week 1 functions, units and charge; Ohm’s law is not required. Allow 90–120 minutes during the existing Thursday/Friday study time, replacing some repeated calculation practice.
¶ Predict before running · 20 minutes
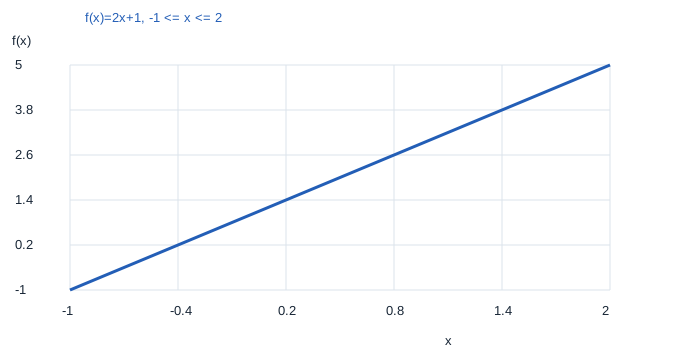
- For f(x)=2x+1 on [−1,2], calculate f(−1), f(0), f(1) and f(2). Predict both intercepts and the range.
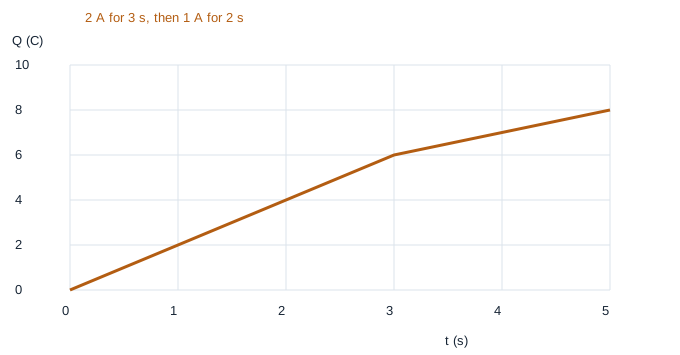
- A cumulative charge Q starts at zero. It rises at 2 C/s for 3 s, then at 1 C/s for 2 s. Find Q at 1, 3 and 5 s. Draw your predicted graph and label units.
- Predict the current during each interval and over the whole 5 s. Explain why a graph’s final height is not the current.
¶ Run the supplied Python lab · 20 minutes
- Download the Week 1 lab package and extract the ZIP archive.
- Open
lab.pyin your Python editor and run it, or runpython3 lab.pyfrom that extracted folder. Python 3 is required; no extra packages are needed. - Read the printed checks. Open the generated SVG graphs in your browser and CSV tables in your preferred spreadsheet.
The package includes reference plots for comparison. Running lab.py regenerates them; opening a reference plot alone does not mean you have run the experiment.
The script creates functions.svg, charge.svg and two CSV tables. Open the SVG files in a browser and the CSV files in a spreadsheet or text editor. You do not need to write or modify any code. Read the column headings and compare at least three rows with your predictions.
¶ Compare and explain · 25 minutes
| Check | Expected result |
|---|---|
| Function samples | −1, 1, 3, 5 |
| Function intercepts | x=−0.5 and y=1 |
| Function range | [−1,5] |
| Q(1), Q(3), Q(5) | 2 C, 6 C, 8 C |
| Interval currents | 2 A, then 1 A |
| Overall average | 8 C / 5 s = 1.6 A |
The charge graph is continuous at 3 s, but its slope changes. Charge already counted does not disappear when the rate decreases. Averaging the two currents without weighting their different durations would give the wrong overall result.
¶ Save a small lab report · 20 minutes
Keep your hand sketch, both generated graphs, three predicted-versus-generated rows and a short explanation of the difference between charge and current. In your private planner note, record what you corrected. Do not publish personal progress on the public wiki.
¶ Readiness checkpoint
Without looking at the graphs, explain the domain restriction, state the function’s slope with its meaning, calculate a current from a charge increment, and distinguish charge height from current slope. If any explanation is unclear, revisit the linked lesson before Week 2. The Saturday exam remains separate.
Optional extension: sketch what would happen if charge stopped crossing the section after 3 s. The graph would stay at 6 C and the later current would be zero. No extra software is needed.